Jun 29, 2007

AZZ - Long

Although I thought today presented better opportunities, I still found myself drawn to a lower volume stock - AZZ - that presented more of a typical 'OONR7' entry on the :10 timeframe:

  • Placed fib. lines from first bar low to second bar high
  • Price retraced and touched the 38% level
  • Fifth bar formed a nice hammer
  • Entered on break of 5th bar high (spread was pretty wide at the time but I still ended up getting filled at the price I wanted. With low volume, I always use limit orders)
  • Exited during the 11:50 bar after noticing resistance at the midway point to the fib. ext.
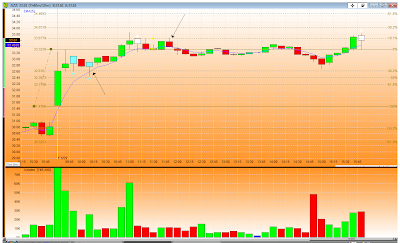
I found AZZ by looking at my scan of top % gainers in prophet.net as I did yesterday with PENX. I don't particularly like low volume stocks, but I'll take a good setup on low volume over a not so good setup on a lot of volume. But... I still like the first :15 of volume to be greater than 100k.

Vacation

I'll be heading back to the states tomorrow for 3 weeks and do not plan on trading all next week. So, posting most likely will be non-existent for the next week. However, I do plan on trading the weeks after that.
I hope to have a chart up later today and possibly another Rise and Fall. If not, I'll see you guys in a week.
 
Good luck.

Jun 28, 2007

PENX - Long

In what I considered to be yet another boring day I was able to get in on a risky - but successful - trade in PENX:

  • Placed fib. lines from 1st bar low to high
  • I watched price retrace down to the 61.8% level, consolidate a bit and then in one solid charge move back up and above the 38% level
  • This is where I thought the trade was risky. There wasn't a ton of overall volume (much less than what I like) at this point and a good chunk of volume came during the 11:15 bar which was also at the $24 level. I waited for a better entry
  • Price consolidated yet again above the 38% level
  • I entered on a break of the 11:25 hammer with increased volume
  • Price quickly shot up but there was a huge difference in the spread which made me very nervous
  • I sold once price hit the fib. ext.

Jun 27, 2007

VPHM

Just because I couldn't trade today doesn't mean I couldn't check out what I could've traded if I would've been trading. Is that enough 'ves for ya? So... I liked VPHM:

  • After initial drop, price proceeded to rise up through the fib. levels
  • The 10:05 bar presented a nice long entry with increased volume
  • Price continued to the intraday fib. ext without any red bars... easy trade

Only thing I didn't like about this is that it happened pretty early and I'm not sure I would've been done with all my scanning by then.

No trading today

Had some personal matters to attend to so I wasn't able to trade today. Any good moves I may have missed?

Jun 26, 2007

Stay the course

For me and the way I trade, the last week and a half have been pretty challenging. Yes, I've had my share of winners, but I haven't really had a whole lot of stocks to choose from. Since last Thursday, I've really stuck to my guns, tried to reduce risk, and passed on countergap trades and trades that stray too far from my ideal entry point. Needless to say, the last couple of days have really felt like slim pickings and the stocks I have entered have forced me to get out of the trade early (which is good since I follow a solid exit strategy and I don't suffer a full 1R loss).
 
So, what do I do???
Do I doubt my system?
Do I try to reinvent the wheel?
 
No, I take my losses like a man. I suck it up and remember that tomorrow I can possibly make a 5R trade again. That's how the market goes. That's how systems go. Nothing is perfect and I will continue to stay the course and go long or short depending on the setup.
On a more uplifting note... King Jamie continues to kick ass.

In case you're bored...

Pretty cool.
 

Stick Figure Battles Designer - Watch more free videos

Jun 24, 2007

Rise or Fall - Revealed

Well, what do you know... I screwed up on a post again. The intraday chart for the last Rise or Fall was actually a 10-min chart... not a 5. Hopefully you all realized it (doesn't change anything but it does reinforce the fact that I'm a horrible editor).
 
Stock: LFC
Entry: Decided to stay put
Rationale: I was actually looking for an entry on the 10:50 bar but volume was not at least 1.25x the previous bar. After this, price proceeded to shoot up and almost touch the fib. ext. during the 11:20 bar before crashing back down during the same bar. So, then came the 12pm bar with serious volume behind it and I was stumped. Should I... or shouldn't I??? I didn't because of the price action on the 11:20 bar. That said a couple things to me: 1) the move might be over and 2) probable target if it did rise was the OR high which was only a .15 gain. So, I didn't see the risk:reward being in my favor especially during last week's crappy market.
But, as you can see... price did rally pretty significantly after 12pm (except for that scary hanging man) and would have produced a nice gain. However, I wasn't hitting myself over the head as I think I made a good decision on what would have been a risky trade (IMO) to begin with.

 
Here's the full view of the chart: 

Rise or Fall - 6/22/07

Hopefully you know the drill with Rise or Fall. At this point in the trade (5-min chart), would you go long, short or stay put... and why?
 
Intraday chart


Daily chart (YTD)

Jun 22, 2007

RGC - Short

My scanner wasn't working this morning so I used IB's top gainers/losers list and found a lot of good opportunities. Here's my RGC trade:

  • Placed fib. levels from first bar high to low (very bearish first bar)
  • Priced retraced to the 61.8 fib. level and failed
  • Price then fell back down to the 38% level and caught a breather during the 10:15 candle
  • Entered short on break of 10:20 candle low (strong down bar with increased volume)
  • Exited on 12:25 candle high (nice Trader-X exit as I waited for a high above the 5ema to be broken)

You'll notice I followed every single step of my trading strategy.
 
EDIT: I was just looking over this chart and it doesn't show price broke the 10:20 candle low on the 10:25 candle. I was actually going to cancel the short order after it didn't take out the low, but... price dropped and the order was filled at 21.35 about :30 secs into the 10:30 candle. A bit fortunate, I guess.

Watchlists... the perfect gift?

Remember when you were a kid on Christmas day... you woke up, ran to the Christmas tree and started tearing into your presents? That feeling, right as you were opening the present - you know - "what can it be???... hot wheels?... new Intellivision game?... remote control car?... Battlestar Gallactica action figure set???" Then, as you tore open the wrapping paper your anxious smile now turned to one of sheer disappointment after finding out all you got was... a pair of pants.
 
Some days the markets give me a pair of pants... some days a kick ass racing car set with dual remote controls.

Jun 21, 2007

My trading style

EDIT: Updated 11/09/2008

As of today, I'm basically trading only off the :15 timeframe. What I look for are NR bars after a pullback to the 5ema. For longs, I don't mind entering on a red candle so long as that candle has a long lower tail and not too much of an upper tail. The same logic applies for shorts... just in reverse. The pullback to the 5ema is key. Here are a few charts to sum up my trading style:


EDIT: This is pretty much outdated. I still use intraday fib. levels for entry points but my overall trading strategy right now is much different.


Rudy asked me in the comments section yesterday to detail my trading style. So, here it is:
  • Intraday fibonacci levels: Fibonacci levels are great as far as showing areas of resistance or support. I typically draw my fibonacci levels from the low to high or high to low of the day and in the direction of price action. So, if price is moving up... I draw it from low to high. If price is moving down... high to low. Now, once the fib. levels are drawn I look to see how price interacts with the certain levels. For instance, if a stock gaps ups I look for price to retrace back to the 38% or 50% level (support) and show me a good entry candle ABOVE the 38% level. Here's an example:

To really understand this concept better, I recommend purchasing the materials from tradethemove.com... that's what I did.
  • Candlestick formations: Using the above chart as an example, if I'm looking to go long, I want a strong candle to form above the 38% fib. level. In this instance, it formed a hammer which is very bullish. Basically, I look for entry bars with little to no upper tails (for longs) or lower tails (for shorts). I am also looking for regular or inside NR7 bars that form at either the 38.2% or 61.8% fib. level.
  • 5ema: For longs, I want the candle to be very near the 5ema and close above it. Vice versa for shorts (close below it).
  • Volume: On my entry bars, I look for volume to be higher than the previous candle (unless it's an inside nr7 bar). This signifies 'backing' behind the potential move. I've recently changed this requirement to be at least 1.25X more than the previous candle.
  • Stock candidates: I mostly look for stocks that have gapped up or down at least 1.5% from the previous close on higher than normal volume.
  • Timeframe: I find my strategy works well with the 5, 10 and 15-min charts.
  • Share size: Risk amount divided by spread of the entry candle or stop loss point. So, if I'm risking $300 per trade and my entry candle spread from high to low is .20, my position size is: 1500 shares. Also, trade within your means when it comes to risk size... .5% of your capital is the norm, but risk whatever you feel you can afford.
  • Stop loss: Generally, it's the opposite side of the candle that I'm entering. So, if I'm going long, my stop loss is the break of the low of my entry candle. However, I sometimes place my stop loss at a fib. level (50% for example). ALWAYS OBEY YOUR STOPS. Take a hit, tomorrow is another day. It's okay to be wrong sometimes. When you think the stock will climb back up... it won't. It's much better to lose $150 than $1500.
That's pretty much it. Simple... that's the way I like it. Now, I also apply these rules when price forms a nice candle at the OR high or low. Also, it's important to look at the whole chart, not just one single candle. The two biggest things I wish I implemented as a new trader 2 years ago were share size and obeying my stops. That would have eliminated 90% of my losses as a trader.

Jun 20, 2007

BIDU won the battle...

I won the war.
 
I initially entered short BIDU off the 7th bar on the :15 chart. I immediately didn't like the spread action, but I wasn't going to get out and lose money without a good reason. So, I waited for a good reason to lose money and was stopped out on the 12th bar. Great thinking. However, I still wanted to short BIDU since price action never really rallied above the 50% intraday fib. level.
 
This is how I won the war:

  • Placed fib. levels from 1st bar low to 1st bar high (very bearish 1st bar)
  • After 10am, price bounced off the 61.8 level a few times, signaling heavy resistance
  • I waited for price to break down below the 38% level on heavy volume which it did during the 12:50 candle
  • Entered (very nervously) on a break of this candle's low and it looked like price might bounce back up again
  • Price dropped hard and I got out without pushing my luck during the 1:20 candle (161.8 fib. level)


I don't consider this a revenge trade as I just waited for a better entry with higher volume behind it. From here on out, I'm creating a new rule for myself. I will not enter a candle unless volume is twice the amount as the previous candle.
 
EDIT: Gonna rethink the volume rule... 2x might be too high.

Jun 19, 2007

Not feeling the love

Not sure about the rest of you guys, but the setups just haven't been there the last couple of days. I was long RSH and short MCHP but the gains - and the charts - were not much to look at so I'm not posting.
 
Trading can be very boring on days like today. But the dramatic pose by the hamster did make me laugh.

The hamster did it

Jun 17, 2007

Rise or Fall - Revealed

Let me apologize for all the formatting changes in last Rise or Fall post. Since this is a customized blogger template, I needed to do things a little differently so everything appears cool in Firefox and IE. That became painfully evident this weekend. In any case, it shouldn't be a problem from here on out.
As for this week's Rise or Fall... here's the trade:
 
Stock: TASR
Entry: Long on break of 10:25 candle
Exit: Ended up selling all shares at the fib. ext at the 11:10 candle. I didn't sell when it first hit the fib. ext as the chart really didn't warrant an exit at the time
Net result: Close to 1.6R
Rationale: Price gapped up and showed a fairly strong first bar on the :15 timeframe so I was looking for a long entry on this one from the get go. Price proceeded to drop below the 61.8 level (bearish sign) but didn't drop too far and quickly regained upward momentum with a very bullish 10:15 candle (5-min chart). My entry bar was very strong on increased volume (higher than the previous 4 candles) and above the 38% fib. level. The entry bar did have a little upper tail, but nothing too scary. I was concerned about the volume spike during the 10:40 candle as it cleared the OR high and was looking to see if a bearish candle formed immediately afterward... which did, but the next candle never took out its low.
 
Here's the full view of the chart:
 

Rise or Fall - 6/16/07

For this week's installment of Rise or Fall, I'm also including a screenshot of the weekly chart. So... at this point in the stock - the point where I made a decision - I'd like to know if you would've gone long, short or decide to stay out of the trade... and why.
 
Here's the intraday, 5-min chart. Blue line is the 5ema:
 
EDIT: This site and chart looks really funky in IE7. So, I encourage everyone to download Firefox. You can import all your current bookmarks... yet, surf the net fast as pages upload much faster in Firefox. From now on, I'm just going to make sure charts show up in IE7 but I'm not going to format the text to conform to IE7. Sorry.
 
UPDATE: I think I solved the problem with IE7. Let me know if you all have any further issues.


Here is the weekly chart for the last 2 years (drawn lines show pivot points):
 

Jun 15, 2007

Salute to X

I didn't trade today partly because OPEX always makes me hesitant with my entries. However, SNDK was on my shortlist today and I was very tempted to go long off the 3rd bar high after it formed a very nice Trader-X 'bread and butter' play.

  • Intraday fibs placed from yesterday's low to today's high of the first bar
  • Priced retraced below the 38% level and the third bar formed a hammer-like candle right above this level on increased volume
  • Profit could've been taken at the fib. ext or 161.8% level


When I first started reading X's blog, he made everything look so easy. I have to admit, it took me a long time to finally 'get it'. Trading live is different from looking at a chart at the end of the day and there are a lot of factors to consider before buying a stock. However, with time, practice and a shitload of chart analysis... it all came together.

X... you will missed and thank you for everything.

Volume at key areas

One thing I've been really focused on the last two days - almost like I rediscovered this - is the relationship between price and volume at key areas of support or resistance. Say I'm in a trade and I enter short above the OR low, which I often do, and price moves towards the OR low and I start seeing some weakness. Sometimes my reaction is 'Get the f out... the sky is falling... abort, abort, abort!!!" However, now I look to see if there's an increase in volume at the key area (say the OR low) and if there's a bullish candle that forms soon afterwards. The screenshot below of ADSK from yesterday shows a good example of what I'm talking about:

  • Red arrow shows increase in volume at the OR low
  • The candles following this increase are not bullish and that's a signal for me to stay with the trade until I get a bullish formation
  • Price continues to drop downward, hit the fib. ext where I sell and realize I fumbled as price dropped even further


Here is a short from the other day (AA) where price fell to the OR low, volume increased and a bullish candle formed afterward. I did get out... and save myself a lot of losses. I probably should've reversed my position at that point.


  • Red arrow shows increase in volume near OR low (support)
  • Very bullish candle formed afterwards which was above the 5ema and then price took out that high


Jun 14, 2007

ADSK - Short

Flatwallet asked me yesterday if I only trade hammers... and this was a portion of my reply:

"...if I see a hanging man after a long run up at a key resistance area, I will short the low of the hanging man..."

A great opportunity came up today to do just that in ADSK. Here's the trade:

  • Placed fib. levels from first bar high to the third bar low
  • Price initially gapped down then quickly started climbing towards the HOD (possible resistance)
  • The 10:15 candle formed an inverted hammer with a long upper tail. A sign of a possible reversal
  • The next candle was a hanging man with slightly increased volume and I shorted the stock on a break of this low
  • Exited at the fib. ext after the increased volume at the OR low failed to generate a reversal (I did not manage this exit well)


I didn't like my exit as it never met the Trader X criteria. I should've waited to see if price took out the high of the 11:30 candle. I basically left .62 on the table. Nevertheless, I'm happy with the trade and anytime you can get out near the fib. ext. for a profit is a good thing.

Global warming... what to do?

This guy makes a lot of sense. Fairly long rationale, but if you want to impress a chick with your theory on global warming and what should be done about it... watch it.


Interesting Argument About Global Warming - Watch more free videos

Jun 13, 2007

FCX - Long

If every stock acted like FCX acted today I would be writing this blog on my 120' tricked out yacht in the British Virgin Islands... Virgin Gorda to be exact. But they don't... so here I am in front of my very untricked out Dell desktop. I can dream, can't I? Here's the trade:

  • Placed fib. levels from first bar low to 3rd bar high
  • Price retraced down and bounced off the 50% fib. level
  • The 10:15 candle formed a perfect hammer right above the 61.8 fib. level with increased volume (if anyone can write code for this kind of formation please let me know). I entered off the high of this candle
  • Price consolidated at the OR high and finally made a push upwards
  • Exited during the 11:45 candle, right above the fib. ext.
Hope you all caught some good trades.

Big cojones trade

I'm sure most of you go back after trading hours and look over charts and find one stock that really took off but presented an entry point that required you to have a set of big cojones. That trade for me today was ROLL. It was on my watchlist but I just wasn't feelin' the countergap groove. I didn't take the trade, but here's my analysis if I did:

  • Placed fib. levels from first bar high to 7th bar low
  • Price retraced strongly back up and through the 61.8% level
  • There was a perfect entry bar on the 10:35 candle (hammerish) which also had increased volume
  • Using the Trader X exit strategy, you could've stayed in this one all the way up to the 12:45 candle
  • That's a $3.7 move or 19R - yes, 19R
Hey, it's rare... but just goes to show that it is possible. I'm very happy with 2R a day, thank you very much. Did anyone get into ROLL?


Jun 11, 2007

FDRY - Long

I found a few good opportunities today that had nice intraday setups which was supported by the daily timeframe as well. I traded FDRY today after noticing it had gapped up and pushed through a fairly recent daily high at $16.63. Here's the intraday chart:

  • Placed fib. levels from first bar low to high (very strong bar)
  • Price retraced down and below 61.8% level, but used the recent daily high as support ($16.63)
  • I was looking for it to convincingly rise up and through the 38% level - which it did along with increasing volume
  • Entered on a break of the 10:55 candle
  • Exited my position at the fib. extention
While this was only a .27 move, my risk at the entry candle was just .07.

Rally car injury

The best part is right at the end.


Passenger of Rally Car Injured - Watch more free videos

Rise or Fall - Revealed

First... thanks to everyone for commenting on the first installment of Rise or Fall. Honestly, I got a helluva lot out of it being that I did make the trade. Reading the comments, I think most of you wouldn't have entered short where I did, which is probably a good thing. So, here's the trade:

Stock: NKE
Entry: Short on break of 10:35 candle
Exit: Scaled out during 11:45 candle
Net result: Made a few bucks
Rationale: I liked how price was bearishly interacting with the 50% level. Plus, this was close to the daily support of 52.50 and price also broke below the daily 50ema. So, I wanted to 'jump the gun', if you will, and short right below daily support at 52.49 which I did. However, this was a risky trade as my entry bar was above the 5ema and price had already made a significant move down earlier in the day. I knew the risk and was ready to bail in order to limit my losses. Initial price target was the OR low or the low of the 3rd bar. If I hadn't scaled out I could've squeezed about .30 out of this before truly exiting after seeing the long lower tails in the 12 and 12:05 candles.

In hindsight... this wouldn't have been my first trade of the day, that's for sure and because of the risk, I only entered with 1/2 my normal position size.
The stock did end up making an upward move but I still don't think you all would've entered as I didn't see any compelling entries on most timeframes.

Daily chart


Intraday chart - full view


Jun 10, 2007

Rise or Fall - 6/09/07

Here's the idea: once a week I'll post segments of charts I either traded or thought of trading and ask you - with all the information you see on the chart - do you think the stock will rise or fall.
I like this exercise because it's good practice for realtime trading. Often times, we look at charts at the end of the day and it's easy to say, 'yeah, I would've entered there.' However, can you call it as it's about to happen?
All I ask is if you think the stock will rise or fall and why. You can also say you wouldn't enter the trade given the information presented.
I'll post the actual chart a few days later or... if no one's commented I'll show it... right after jumping out a window from blogging loneliness.

EDIT: Forgot to mention, this is a 5-min chart.


I've also cut out the stock info so you cheaters can't... well, cheat.

Nadal vs. Federer

Nadal won his third straight French Open... and deserved to win. All I have to say is Federer will go down as the greatest tennis player that ever lived and will win more titles than Sampras. But, if he ever meets Nadal in the French finals again... he will always lose. Nadal is in his head!!! Federer had 8 break chances in the first set - 8 - and converted none. You don't do that in the finals. You don't miss those chances against Nadal.

Jun 8, 2007

Let the blogging begin

Ever the one to catch on to a fad after it's been in existence for years... I have decided to start my own daytrading blog. Why??? I don't know, I kinda enjoy the freedom of having my own blog and doing and saying pretty much whatever I want.
Oh... and it's a good way for me to stay 'honest' with my trading. I figure since I've learned so much from others out there, maybe through this blog I can pass along some helpful trading tips.
Enjoy the blog!

To kick off the blog, I absolutely needed a good trade. So, what better day than today when I got short TTI. Here's the trade (5-min):

  • Placed fib. levels from first bar high to low
  • Price retraced to 50% level and fell back
  • Price retraced again to the 50% and printed a shooting star-like candle (with increased volume)
  • Entered on a break of the 10:15 candle
  • I looked at the daily chart and saw a nice support area at $25.46 (from 5/7) and used that as my target (kudos to Jamie)
  • Exited my entire position when price hit this level